共计 2399 个字符,预计需要花费 6 分钟才能阅读完成。
这篇文章给大家分享的是有关如何搭建 Grafana+Prometheus 监控系统的内容。丸趣 TV 小编觉得挺实用的,因此分享给大家做个参考,一起跟随丸趣 TV 小编过来看看吧。
一 安装部署
监控多台服务器常常采用 Grafana+Prometheus+Exporter 的方式。这套监控框架的架构示意图如下:

图 1 监控系统架构图
Exporter 定期连续收集本地主机的性能指标。
Prometheus 采集多个 Exporter 的指标数据,汇聚存储在 prometheus 数据库。
Grafana 是可视化面板,可以多种展示形式展示 prometheus 指标数据库的数据,同时 Grafana 提供了大量已开发好的可视化面板供使用,大部分情况下无需开发。
下面以 windows 平台为例搭建监控系统
1.1 Exporter 安装
Exporter 在不同操作系统下的名称不一样,在 Linux 下是 node-exported,Windows 下是 windows_exported。
从 https://github.com/prometheus-community/windows_exporter/releases 下载安装包,在 windows 下执行命令:
msiexec /i windows_exporter-0.16.0-amd64.msi ENABELD_COLLECTORS= os,cpu,cs.logical_disk,net,system,process LISTEN_PORT= 19182 EXTRA_FLAGS= –collector.process.whitelist=abc|windows_exporter
其中 LISTEN_PORT= 19182 是配置 Exporter 的访问端口号,可以修改。
安装完成后访问 http://localhost:19182/metrics,能看到 Metrics 就是成功了:
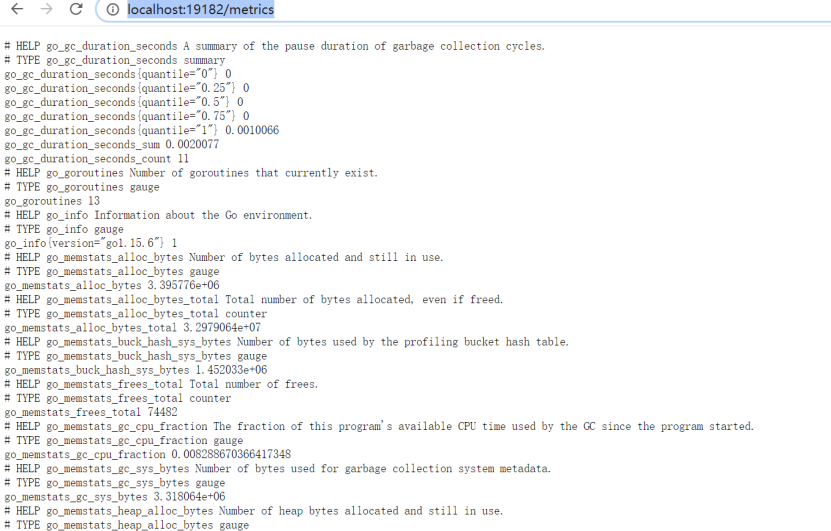
1.2 Prometheus 安装
Prometheus 存储的是时序数据,即按相同时序(相同名称和标签),以时间维度存储连续的数据的集合。
时序 (time series) 是由名字 (Metric) 以及一组 key/value 标签定义的,具有相同的名字以及标签属于相同时序。
Linux 下安装步骤:
wget https://github.com/prometheus/prometheus/releases/download/v2.12.0/prometheus-2.12.0.linux-amd64.tar.gz
tar -zxf prometheus-2.12.0.linux-amd64.tar.gz
mv prometheus-2.12.0.linux-amd64 prometheus
chown root.root prometheus -R
# 直接启动
nohup ./prometheus –config.file=prometheus.yml 2 1 1 prometheus.log
# 查看服务
[root@VM_0_13_centos pushgateway]# netstat -lntup |grep prometheus
tcp6 0 0 :::9090 :::* LISTEN 16655/prometheus
windows 下安装步骤:
直接下载 prometheus-2.26.0.windows-amd64.zip 压缩包,解压后配置 prometheus.yml 然后启动 prometheus 即可。默认端口 9090。
prometheus 配置
主要需要配置的东西是采集对象 targets,targets 支持多个。
如果一个 job 里有多台主机,只需要在 targets 里配置多个 ip 和端口即可,使用逗号隔开
[root@bogon prometheus]# cat prometheus.yml |grep -v # |grep -v ^$|tail -n 7
scrape_configs:
– job_name: prometheus
static_configs:
– targets: [localhost:9090 , localhost:19182]
– job_name: node
static_configs:
– targets: [192.168.68.17:9100]
重启之后,在 prometheus 里看到 Targets 是这样的:
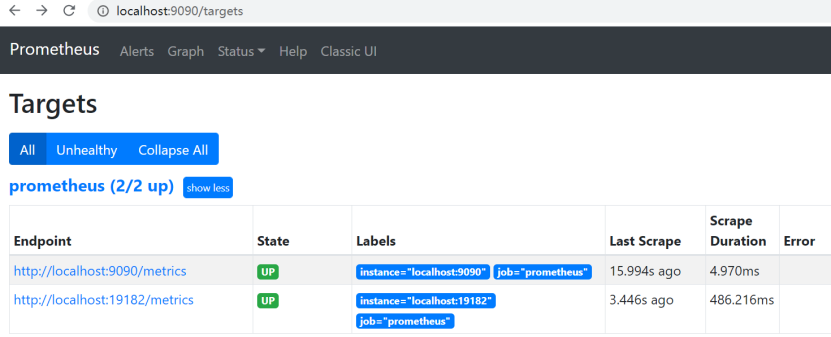
State=UP 表示 prometheus 已经成功采集到 Exporter 的数据了。
1.3 Grafana 安装配置
Grafana 是一款用 Go 语言开发的开源数据可视化工具,可以做数据监控和数据统计。
从 grafana 官网下载对应环境的最新版本压缩包。默认端口 3000。
构建 dashboard,比如图表、状态值、表格等等。官网上有很多现成的 Dashboard 可以导入(https://grafana.com/grafana/dashboards),两种方式可以导入:一种是从网站上下载对应 dashboard 的 json 文件;另一种是在 grafana 管理台输入 dashboard 的 ID。
安装监控面板
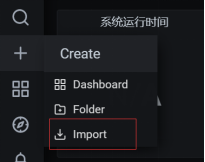 点击”Import”按钮,
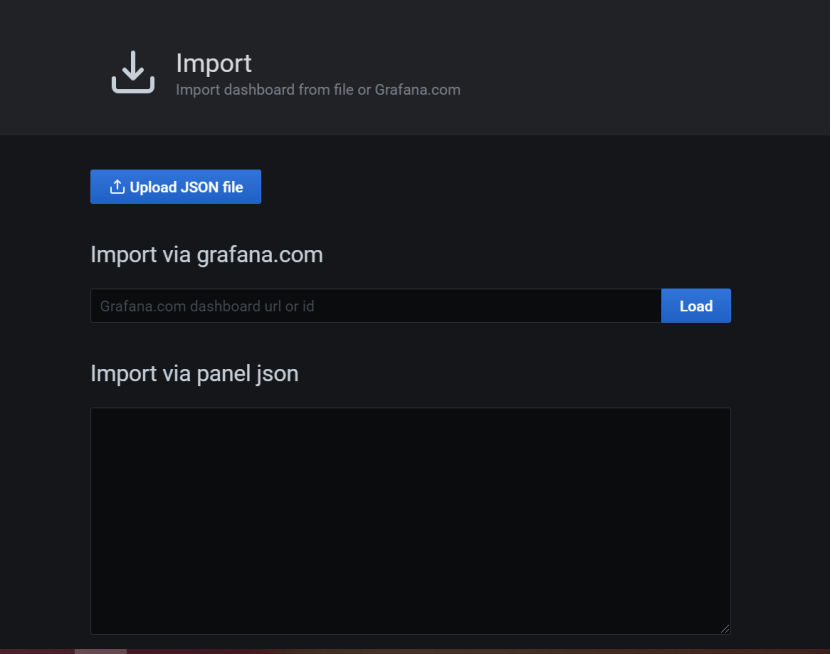
Import 界面支持 ID 和 json 两种导入方式。
在添加界面里输入 10467 来添加 windows 的 prometheus 监控面板。(Linux 监控面板:8919,9276 等;Windows 监控面板:10467)。
UI 示意图如下所示:
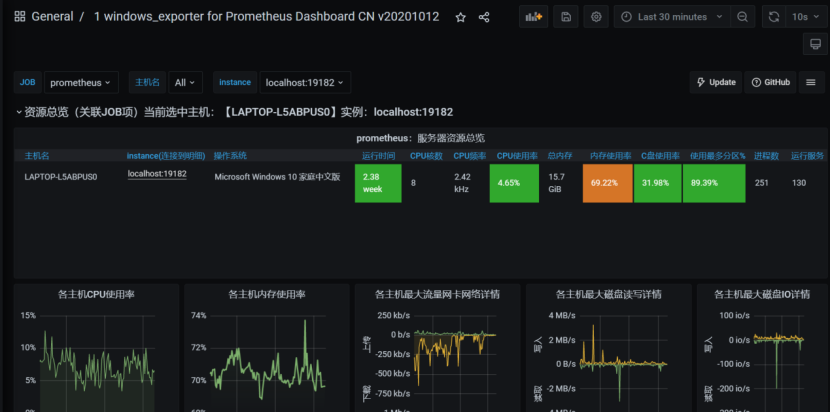
注意对于 windows 平台和 linux 平台来说,监控 Exporter 数据的面板是互相不兼容的,一定要适配好操作系统的类型。
【注】
如果打开 Import 界面后显示的是下面这样的:

那么必须要点击 Cancel 按钮,然后才能进入空白的 Import 界面。
感谢各位的阅读!关于“如何搭建 Grafana+Prometheus 监控系统”这篇文章就分享到这里了,希望以上内容可以对大家有一定的帮助,让大家可以学到更多知识,如果觉得文章不错,可以把它分享出去让更多的人看到吧!


