共计 15243 个字符,预计需要花费 39 分钟才能阅读完成。
自动写代码机器人,免费开通
这篇文章主要介绍了 Redis 偶发连接失败怎么办,具有一定借鉴价值,感兴趣的朋友可以参考下,希望大家阅读完这篇文章之后大有收获,下面让丸趣 TV 小编带着大家一起了解一下。
前言
本文主要给大家介绍了关于 Redis 偶发连接失败的相关内容,分享出来供大家参考学习,下面话不多说了,来一起看看详细的介绍吧
【作者】
张延俊:携程技术保障中心资深 DBA,对数据库架构和疑难问题分析排查有浓厚的兴趣。
寿向晨:携程技术保障中心高级 DBA,主要负责携程 Redis 及 DB 的运维工作,在自动化运维,流程化及监控排障等方面有较多的实践经验,喜欢深入分析问题,提高团队运维效率。
【问题描述】
生产环境有一个 Redis 会偶尔发生连接失败的报错,报错的时间点、客户端 IP 并没有特别明显的规律,过一会儿,报错会自动恢复。
以下是客户端报错信息:
CRedis.Client.RExceptions.ExcuteCommandException: Unable to Connect redis server: ---  CRedis.Third.Redis.RedisException: Unable to Connect redis server:
  在  CRedis.Third.Redis.RedisNativeClient.CreateConnectionError()
  在  CRedis.Third.Redis.RedisNativeClient.SendExpectData(Byte[][] cmdWithBinaryArgs)
  在  CRedis.Client.Entities.RedisServer. c__DisplayClassd`1.
从报错的信息来看,应该是连接不上 Redis 所致。Redis 的版本是 2.8.19。虽然版本有点老,但基本运行稳定。
线上环境只有这个集群有偶尔报错。这个集群的一个比较明显的特征是客户端服务器比较多,有上百台。
【问题分析】
从报错的信息来看,客户端连接不到服务端。常见的原因有以下几点:
一个常见的原因是由于端口耗尽,对网络连接进行排查,在出问题的点上,TCP 连接数远没有达到端口耗尽的场景,因此这个不是 Redis 连接不上的根本原因。
另外一种常见的场景是在服务端有慢查询,导致 Redis 服务阻塞。我们在 Redis 服务端,把运行超过 10 毫秒的语句进行抓取,也没有抓到运行慢的语句。
从服务端的部署的监控来看,出问题的点上,连接数有一个突然飙升,从 3500 个连接突然飙升至 4100 个连接。如下图显示:

同时间,服务器端显示 Redis 服务端有丢包现象:345539 – 344683 = 856 个包。
Sat Apr 7 10:41:40 CST 2018
 1699 outgoing packets dropped
 92 dropped because of missing route
 344683 SYNs to LISTEN sockets dropped
 344683 times the listen queue of a socket overflowed
Sat Apr 7 10:41:41 CST 2018
 1699 outgoing packets dropped
 92 dropped because of missing route
 345539 SYNs to LISTEN sockets dropped
 345539 times the listen queue of a socket overflowed
客户端报错的原因基本确定,是因为建连速度太快,导致服务端 backlog 队列溢出,连接被 server 端 reset。
【关于 backlog overflow】
在高并发的短连接服务中,这是一种很常见的 tcp 报错类型。一个正常的 tcp 建连过程如下:
1.client 发送一个 (SYN) 给 server
2.server 返回一个 (SYN,ACK) 给 client
3.client 返回一个(ACK)
三次握手结束,对 client 来说建连成功,client 可以继续发送数据包给 server,但是这个时候 server 端未必 ready,如下图所示:
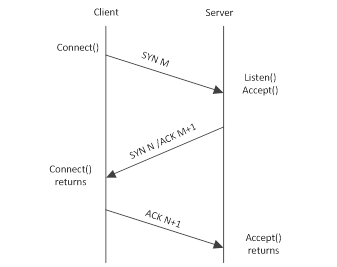
在 BSD 版本内核实现的 tcp 协议中,server 端建连过程需要两个队列,一个是 SYN queue,一个是 accept queue。前者叫半开连接(或者半连接)队列,在接收到 client 发送的 SYN 时加入队列。(一种常见的网络攻击方式就是不断发送 SYN 但是不发送 ACK 从而导致 server 端的半开队列撑爆,server 端拒绝服务。)后者叫全连接队列,server 返回(SYN,ACK),在接收到 client 发送 ACK 后(此时 client 会认为建连已经完成,会开始发送 PSH 包),如果 accept queue 没有满,那么 server 从 SYN queue 把连接信息移到 accept queue;如果此时 accept queue 溢出的话,server 的行为要看配置。如果 tcp_abort_on_overflow 为 0(默认),那么直接 drop 掉 client 发送的 PSH 包,此时 client 会进入重发过程,一段时间后 server 端重新发送 SYN,ACK,重新从建连的第二步开始;如果 tcp_abort_on_overflow 为 1,那么 server 端发现 accept queue 满之后直接发送 reset。
通过 wireshark 搜索发现在一秒内有超过 2000 次对 Redis Server 端发起建连请求。我们尝试修改 tcp backlog 大小,从 511 调整到 2048, 问题并没有得到解决。所以此类微调,并不能彻底的解决问题。
【网络包分析】
我们用 wireshark 来识别网络拥塞的准确时间点和原因。我们已经有了准确的报错时间点,先用 editcap 把超大的 tcp 包裁剪一下,裁成 30 秒间隔,并通过 wireshark I/O 100ms 间隔分析网络阻塞的准确时间点:

根据图标可以明显看到 tcp 的 packets 来往存在 block。
对该 block 前后的网络包进行明细分析,网络包来往情况如下:
TimeSourceDestDescription 12:01:54.6536050 Redis-Server Clients TCP:Flags=…AP… 12:01:54.6538580 Redis-Server Clients TCP:Flags=…AP… 12:01:54.6539770 Redis-Server Clients TCP:Flags=…AP… 12:01:54.6720580 Redis-Server Clients TCP:Flags=…A..S.. 12:01:54.6727200 Redis-Server Clients TCP:Flags=…A…… 12:01:54.6808480 Redis-Server Clients TCP:Flags=…AP….. 12:01:54.6910840 Redis-Server Clients TCP:Flags=…A…S., 12:01:54.6911950 Redis-Server Clients TCP:Flags=…A…… … … … … 12:01:56.1181350 Redis-Server Clients TCP:Flags=…AP….
12:01:54.6808480, Redis Server 端向客户端发送了一个 Push 包,也就是对于查询请求的一个结果返回。后面的包都是在做连接处理,包括 Ack 包,Ack 确认包,以及重置的 RST 包,紧接着下面一个 Push 包是在 12:01:56.1181350 发出的。中间的间隔是 1.4372870 秒。也就是说,在这 1.4372870 秒期间,Redis 的服务器端,除了做一个查询,其他的操作都是在做建连,或拒绝连接。
客户端报错的前后逻辑已经清楚了,redis-server 卡了 1.43 秒,client 的 connection pool 被打满,疯狂新建连接,server 的 accept queue 满,直接拒绝服务,client 报错。开始怀疑 client 发送了特殊命令,这时需要确认一下 client 的最后几个命令是什么,找到 redis-server 卡死前的第一个包,装一个 wireshark 的 redis 插件,看到最后几个命令是简单的 get,并且 key-value 都很小,不至于需要耗费 1.43 秒才能完成。服务端也没有 slow log,此时排障再次陷入僵局。
【进一步分析】
为了了解这 1.43 秒之内,Redis Server 在做什么事情,我们用 pstack 来抓取信息。Pstack 本质上是 gdb attach. 高频率的抓取会影响 redis 的吞吐。死循环 0.5 秒一次无脑抓,在 redis-server 卡死的时候抓到堆栈如下(过滤了没用的栈信息):
Thu May 31 11:29:18 CST 2018
Thread 1 (Thread 0x7ff2db6de720 (LWP 8378)):
#0 0x000000000048cec4 in ?? ()
#1 0x00000000004914a4 in je_arena_ralloc ()
#2 0x00000000004836a1 in je_realloc ()
#3 0x0000000000422cc5 in zrealloc ()
#4 0x00000000004213d7 in sdsRemoveFreeSpace ()
#5 0x000000000041ef3c in clientsCronResizeQueryBuffer ()
#6 0x00000000004205de in clientsCron ()
#7 0x0000000000420784 in serverCron ()
#8 0x0000000000418542 in aeProcessEvents ()
#9 0x000000000041873b in aeMain ()
#10 0x0000000000420fce in main ()
Thu May 31 11:29:19 CST 2018
Thread 1 (Thread 0x7ff2db6de720 (LWP 8378)):
#0 0x0000003729ee5407 in madvise () from /lib64/libc.so.6
#1 0x0000000000493a4e in je_pages_purge ()
#2 0x000000000048cf70 in ?? ()
#3 0x00000000004914a4 in je_arena_ralloc ()
#4 0x00000000004836a1 in je_realloc ()
#5 0x0000000000422cc5 in zrealloc ()
#6 0x00000000004213d7 in sdsRemoveFreeSpace ()
#7 0x000000000041ef3c in clientsCronResizeQueryBuffer ()
#8 0x00000000004205de in clientsCron ()
#9 0x0000000000420784 in serverCron ()
#10 0x0000000000418542 in aeProcessEvents ()
#11 0x000000000041873b in aeMain ()
#12 0x0000000000420fce in main ()
Thu May 31 11:29:19 CST 2018
Thread 1 (Thread 0x7ff2db6de720 (LWP 8378)):
#0 0x000000000048108c in je_malloc_usable_size ()
#1 0x0000000000422be6 in zmalloc ()
#2 0x00000000004220bc in sdsnewlen ()
#3 0x000000000042c409 in createStringObject ()
#4 0x000000000042918e in processMultibulkBuffer ()
#5 0x0000000000429662 in processInputBuffer ()
#6 0x0000000000429762 in readQueryFromClient ()
#7 0x000000000041847c in aeProcessEvents ()
#8 0x000000000041873b in aeMain ()
#9 0x0000000000420fce in main ()
Thu May 31 11:29:20 CST 2018
Thread 1 (Thread 0x7ff2db6de720 (LWP 8378)):
#0 0x000000372a60e7cd in write () from /lib64/libpthread.so.0
#1 0x0000000000428833 in sendReplyToClient ()
#2 0x0000000000418435 in aeProcessEvents ()
#3 0x000000000041873b in aeMain ()
#4 0x0000000000420fce in main ()
重复多次抓取后,从堆栈中发现可疑堆栈 clientsCronResizeQueryBuffer 位置,属于 serverCron()函数下,这个 redis-server 内部的定时调度,并不在用户线程下,这个解释了为什么卡死的时候没有出现慢查询。
查看 redis 源码,确认到底 redis-server 在做什么:
clientsCron(server.h):
#define CLIENTS_CRON_MIN_ITERATIONS 5
void clientsCron(void) {
 /* Make sure to process at least numclients/server.hz of clients
 * per call. Since this function is called server.hz times per second
 * we are sure that in the worst case we process all the clients in 1
 * second. */
 int numclients = listLength(server.clients);
 int iterations = numclients/server.hz;
 mstime_t now = mstime();
 /* Process at least a few clients while we are at it, even if we need
 * to process less than CLIENTS_CRON_MIN_ITERATIONS to meet our contract
 * of processing each client once per second. */
 if (iterations   CLIENTS_CRON_MIN_ITERATIONS)
 iterations = (numclients   CLIENTS_CRON_MIN_ITERATIONS) ?
 numclients : CLIENTS_CRON_MIN_ITERATIONS;
 while(listLength(server.clients)   iterations--) {
 client *c;
 listNode *head;
 /* Rotate the list, take the current head, process.
 * This way if the client must be removed from the list it s the
 * first element and we don t incur into O(N) computation. */
 listRotate(server.clients);
 head = listFirst(server.clients);
 c = listNodeValue(head);
 /* The following functions do different service checks on the client.
 * The protocol is that they return non-zero if the client was
 * terminated. */
 if (clientsCronHandleTimeout(c,now)) continue;
 if (clientsCronResizeQueryBuffer(c)) continue;
 }
}
clientsCron 首先判断当前 client 的数量,用于控制一次清理连接的数量,生产服务器单实例的连接数量在 5000 不到,也就是一次清理的连接数是 50 个。
clientsCronResizeQueryBuffer(server.h):
/* The client query buffer is an sds.c string that can end with a lot of
 * free space not used, this function reclaims space if needed.
 *
 * The function always returns 0 as it never terminates the client. */
int clientsCronResizeQueryBuffer(client *c) { size_t querybuf_size = sdsAllocSize(c- querybuf);
 time_t idletime = server.unixtime - c- lastinteraction;
 /*  只在以下两种情况下会 Resize query buffer:
 * 1) Query buffer   BIG_ARG(在 server.h  中定义 #define PROTO_MBULK_BIG_ARG (1024*32))
  且这个 Buffer 的小于一段时间的客户端使用的峰值.
 * 2)  客户端空闲超过 2s 且 Buffer size 大于 1k. */
 if (((querybuf_size   PROTO_MBULK_BIG_ARG)
 (querybuf_size/(c- querybuf_peak+1))   2) ||
 (querybuf_size   1024   idletime   2))
 {
 /* Only resize the query buffer if it is actually wasting space. */
 if (sdsavail(c- querybuf)   1024) { c- querybuf = sdsRemoveFreeSpace(c- querybuf);
 }
 }
 /* Reset the peak again to capture the peak memory usage in the next
 * cycle. */
 c- querybuf_peak = 0;
 return 0;
}
如果 redisClient 对象的 query buffer 满足条件,那么就直接 resize 掉。满足条件的连接分成两种,一种是真的很大的,比该客户端一段时间内使用的峰值还大;还有一种是很闲(idle 2)的,这两种都要满足一个条件,就是 buffer free 的部分超过 1k。那么 redis-server 卡住的原因就是正好有那么 50 个很大的或者空闲的并且 free size 超过了 1k 大小连接的同时循环做了 resize,由于 redis 都属于单线程工作的程序,所以 block 了 client。那么解决这个问题办法就很明朗了,让 resize 的频率变低或者 resize 的执行速度变快。
既然问题出在 query buffer 上,我们先看一下这个东西被修改的位置:
readQueryFromClient(networking.c):
redisClient *createClient(int fd) { redisClient *c = zmalloc(sizeof(redisClient));
 /* passing -1 as fd it is possible to create a non connected client.
 * This is useful since all the Redis commands needs to be executed
 * in the context of a client. When commands are executed in other
 * contexts (for instance a Lua script) we need a non connected client. */
 if (fd != -1) { anetNonBlock(NULL,fd);
 anetEnableTcpNoDelay(NULL,fd);
 if (server.tcpkeepalive)
 anetKeepAlive(NULL,fd,server.tcpkeepalive);
 if (aeCreateFileEvent(server.el,fd,AE_READABLE,
 readQueryFromClient, c) == AE_ERR)
 { close(fd);
 zfree(c);
 return NULL;
 }
 }
 selectDb(c,0);
 c- id = server.next_client_id++;
 c- fd = fd;
 c- name = NULL;
 c- bufpos = 0;
 c- querybuf = sdsempty();  初始化是 0
readQueryFromClient(networking.c):
void readQueryFromClient(aeEventLoop *el, int fd, void *privdata, int mask) { redisClient *c = (redisClient*) privdata;
 int nread, readlen;
 size_t qblen;
 REDIS_NOTUSED(el);
 REDIS_NOTUSED(mask);
 server.current_client = c;
 readlen = REDIS_IOBUF_LEN;
 /* If this is a multi bulk request, and we are processing a bulk reply
 * that is large enough, try to maximize the probability that the query
 * buffer contains exactly the SDS string representing the object, even
 * at the risk of requiring more read(2) calls. This way the function
 * processMultiBulkBuffer() can avoid copying buffers to create the
 * Redis Object representing the argument. */
 if (c- reqtype == REDIS_REQ_MULTIBULK   c- multibulklen   c- bulklen != -1
   c- bulklen  = REDIS_MBULK_BIG_ARG)
 { int remaining = (unsigned)(c- bulklen+2)-sdslen(c- querybuf);
 if (remaining   readlen) readlen = remaining;
 }
 qblen = sdslen(c- querybuf);
 if (c- querybuf_peak   qblen) c- querybuf_peak = qblen;
 c- querybuf = sdsMakeRoomFor(c- querybuf, readlen);  在这里会被扩大
由此可见 c - querybuf 在连接第一次读取命令后的大小就会被分配至少 1024*32,所以回过头再去看 resize 的清理逻辑就明显存在问题,每个被使用到的 query buffer 的大小至少就是 1024*32,但是清理的时候判断条件是 1024,也就是说,所有的 idle 2 的被使用过的连接都会被 resize 掉,下次接收到请求的时候再重新分配到 1024*32,这个其实是没有必要的,在访问比较频繁的群集,内存会被频繁得回收重分配,所以我们尝试将清理的判断条件改造为如下,就可以避免大部分没有必要的 resize 操作:
if (((querybuf_size   REDIS_MBULK_BIG_ARG)
 (querybuf_size/(c- querybuf_peak+1))   2) ||
 (querybuf_size   1024*32   idletime   2))
 {
 /* Only resize the query buffer if it is actually wasting space. */
 if (sdsavail(c- querybuf)   1024*32) { c- querybuf = sdsRemoveFreeSpace(c- querybuf);
 }
 }
这个改造的副作用是内存的开销,按照一个实例 5k 连接计算,5000*1024*32=160M,这点内存消耗对于上百 G 内存的服务器完全可以接受。
【问题重现】
在使用修改过源码的 Redis server 后,问题仍然重现了,客户端还是会报同类型的错误,且报错的时候,服务器内存依然会出现抖动。抓取内存堆栈信息如下:
Thu Jun 14 21:56:54 CST 2018
#3 0x0000003729ee893d in clone () from /lib64/libc.so.6
Thread 1 (Thread 0x7f2dc108d720 (LWP 27851)):
#0 0x0000003729ee5400 in madvise () from /lib64/libc.so.6
#1 0x0000000000493a1e in je_pages_purge ()
#2 0x000000000048cf40 in arena_purge ()
#3 0x00000000004a7dad in je_tcache_bin_flush_large ()
#4 0x00000000004a85e9 in je_tcache_event_hard ()
#5 0x000000000042c0b5 in decrRefCount ()
#6 0x000000000042744d in resetClient ()
#7 0x000000000042963b in processInputBuffer ()
#8 0x0000000000429762 in readQueryFromClient ()
#9 0x000000000041847c in aeProcessEvents ()
#10 0x000000000041873b in aeMain ()
#11 0x0000000000420fce in main ()
Thu Jun 14 21:56:54 CST 2018
Thread 1 (Thread 0x7f2dc108d720 (LWP 27851)):
#0 0x0000003729ee5400 in madvise () from /lib64/libc.so.6
#1 0x0000000000493a1e in je_pages_purge ()
#2 0x000000000048cf40 in arena_purge ()
#3 0x00000000004a7dad in je_tcache_bin_flush_large ()
#4 0x00000000004a85e9 in je_tcache_event_hard ()
#5 0x000000000042c0b5 in decrRefCount ()
#6 0x000000000042744d in resetClient ()
#7 0x000000000042963b in processInputBuffer ()
#8 0x0000000000429762 in readQueryFromClient ()
#9 0x000000000041847c in aeProcessEvents ()
#10 0x000000000041873b in aeMain ()
#11 0x0000000000420fce in main ()
显然,Querybuffer 被频繁 resize 的问题已经得到了优化,但是还是会出现客户端报错。这就又陷入了僵局。难道还有其他因素导致 query buffer resize 变慢?我们再次抓取 pstack。但这时,jemalloc 引起了我们的注意。此时回想 Redis 的内存分配机制,Redis 为避免 libc 内存不被释放导致大量内存碎片的问题,默认使用的是 jemalloc 用作内存分配管理,这次报错的堆栈信息中都是 je_pages_purge () redis 在调用 jemalloc 回收脏页。我们看下 jemalloc 做了些什么:
arena_purge(arena.c)
static void
arena_purge(arena_t *arena, bool all)
 arena_chunk_t *chunk;
 size_t npurgatory;
 if (config_debug) {
 size_t ndirty = 0;
 arena_chunk_dirty_iter( arena- chunks_dirty, NULL,
 chunks_dirty_iter_cb, (void *) ndirty);
 assert(ndirty == arena- ndirty);
 }
 assert(arena- ndirty   arena- npurgatory || all);
 assert((arena- nactive   opt_lg_dirty_mult)   (arena- ndirty -
 arena- npurgatory) || all);
 if (config_stats)
 arena- stats.npurge++;
 npurgatory = arena_compute_npurgatory(arena, all);
 arena- npurgatory += npurgatory;
 while (npurgatory   0) {
 size_t npurgeable, npurged, nunpurged;
 /* Get next chunk with dirty pages. */
 chunk = arena_chunk_dirty_first(arena- chunks_dirty);
 if (chunk == NULL) {
 arena- npurgatory -= npurgatory;
 return;
 }
 npurgeable = chunk- ndirty;
 assert(npurgeable != 0);
 if (npurgeable   npurgatory   chunk- nruns_adjac == 0) {

 arena- npurgatory += npurgeable - npurgatory;
 npurgatory = npurgeable;
 }
 arena- npurgatory -= npurgeable;
 npurgatory -= npurgeable;
 npurged = arena_chunk_purge(arena, chunk, all);
 nunpurged = npurgeable - npurged;
 arena- npurgatory += nunpurged;
 npurgatory += nunpurged;
 }
}
Jemalloc 每次回收都会判断所有实际应该清理的 chunck 并对清理做 count,这个操作对于高响应要求的系统是很奢侈的,所以我们考虑通过升级 jemalloc 的版本来优化 purge 的性能。Redis 4.0 版本发布后,性能有很大的改进,并可以通过命令回收内存,我们线上也正准备进行升级,跟随 4.0 发布的 jemalloc 版本为 4.1,jemalloc 的版本使用的在 jemalloc 的 4.0 之后版本的 arena_purge()做了很多优化,去掉了计数器的调用,简化了很多判断逻辑,增加了 arena_stash_dirty()方法合并了之前的计算和判断逻辑,增加了 purge_runs_sentinel,用保持脏块在每个 arena LRU 中的方式替代之前的保持脏块在 arena 树的 dirty-run-containing chunck 中的方式,大幅度减少了脏块 purge 的体积,并且在内存回收过程中不再移动内存块。代码如下:
arena_purge(arena.c)
static void
arena_purge(arena_t *arena, bool all)
 chunk_hooks_t chunk_hooks = chunk_hooks_get(arena);
 size_t npurge, npurgeable, npurged;
 arena_runs_dirty_link_t purge_runs_sentinel;
 extent_node_t purge_chunks_sentinel;
 arena- purging = true;
 /*
 * Calls to arena_dirty_count() are disabled even for debug builds
 * because overhead grows nonlinearly as memory usage increases.
 */
 if (false   config_debug) { size_t ndirty = arena_dirty_count(arena);
 assert(ndirty == arena- ndirty);
 }
 assert((arena- nactive   arena- lg_dirty_mult)   arena- ndirty || all);
 if (config_stats)
 arena- stats.npurge++;
 npurge = arena_compute_npurge(arena, all);
 qr_new(purge_runs_sentinel, rd_link);
 extent_node_dirty_linkage_init(purge_chunks_sentinel);
 npurgeable = arena_stash_dirty(arena,  chunk_hooks, all, npurge,
  purge_runs_sentinel,  purge_chunks_sentinel);
 assert(npurgeable  = npurge);
 npurged = arena_purge_stashed(arena,  chunk_hooks,  purge_runs_sentinel,
  purge_chunks_sentinel);
 assert(npurged == npurgeable);
 arena_unstash_purged(arena,  chunk_hooks,  purge_runs_sentinel,
  purge_chunks_sentinel);
 arena- purging = false;
}
【解决问题】
实际上我们有多个选项。可以使用 Google 的 tcmalloc 来代替 jemalloc,可以升级 jemalloc 的版本等等。我们根据上面的分析,尝试通过升级 jemalloc 版本,实际操作为升级 Redis 版本来解决。我们将 Redis 的版本升级到 4.0.9 之后观察,线上客户端连接超时这个棘手的问题得到了解决。
【问题总结】
Redis 在生产环境中因其支持高并发,响应快,易操作被广泛使用,对于运维人员而言,其响应时间的要求带来了各种各样的问题,Redis 的连接超时问题是其中比较典型的一种,从发现问题,客户端连接超时,到通过抓取客户端与服务端的网络包,内存堆栈定位问题,也被其中一些假象所迷惑,最终通过升级 jemalloc(Redis)的版本解决问题,这次最值得总结和借鉴的是整个分析的思路。
感谢你能够认真阅读完这篇文章,希望丸趣 TV 小编分享的“Redis 偶发连接失败怎么办”这篇文章对大家有帮助,同时也希望大家多多支持丸趣 TV,关注丸趣 TV 行业资讯频道,更多相关知识等着你来学习!
向 AI 问一下细节


